0%

pheatmap包绘制热图

本文总结利用pheatmap包绘制热图。

1. 先构造基因表达的原始矩阵数据

1
2
3
4
5
6
7
8
9
10
11
12
13
14
15
library(pheatmap)

test = matrix(rnorm(200), 20, 10)
test[1:10, seq(1, 10, 2)] = test[1:10, seq(1, 10, 2)] + 3
test[11:20, seq(2, 10, 2)] = test[11:20, seq(2, 10, 2)] + 2
test[15:20, seq(2, 10, 2)] = test[15:20, seq(2, 10, 2)] + 4
colnames(test) = paste("Test", 1:10, sep = "")
rownames(test) = paste("Gene", 1:20, sep = "")
Test1 Test2 Test3 Test4 Test5 Test6 Test7 Test8 Test9 Test10
Gene1 2.476974 -0.7096602 3.405717 -0.1529692 1.686829 -1.7756402 4.160293 -0.09614398 2.273536 -0.24355689
Gene2 0.922408 0.7340569 1.467666 0.2049912 3.148910 -1.7416155 3.881041 -0.03267105 1.842824 -0.90024776
Gene3 3.351652 -1.3851371 3.402637 1.0768550 1.945714 -0.6581165 2.577626 -1.40488930 2.605290 0.02030097
Gene4 4.303986 1.7070171 3.690117 0.1744926 3.244208 -0.3064566 2.977539 -0.78373884 4.813468 0.59676061
Gene5 2.603092 -0.0881564 3.983556 -0.1484519 3.618336 0.8662581 2.292649 0.69703269 3.105478 0.45457643
Gene6 2.255703 -0.3186929 4.288485 -0.1407605 2.351381 -0.3532394 2.147897 0.61440403 3.328062 0.44279539

2. 绘制热图

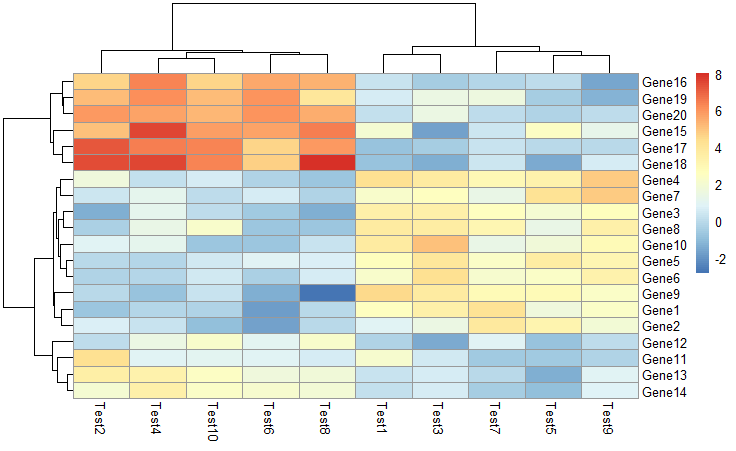
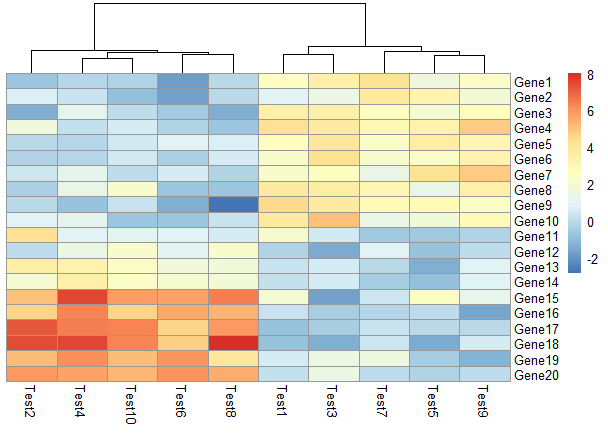
默认参数:

1
pheatmap(test)

图标

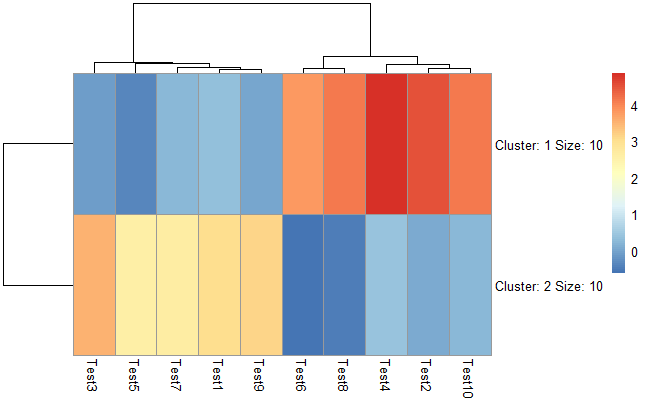
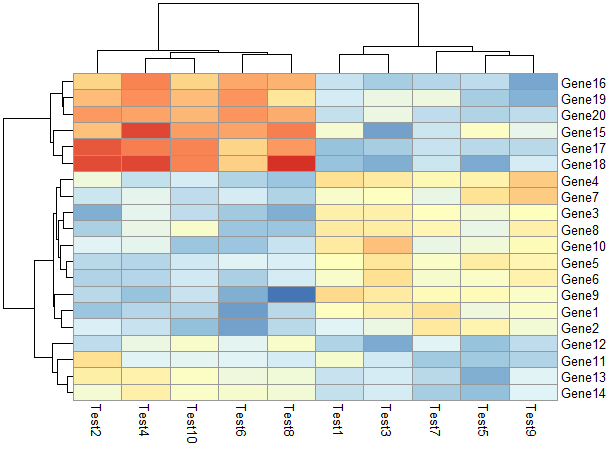
设置聚成几类

1
pheatmap(test, kmeans_k = 2)

图标

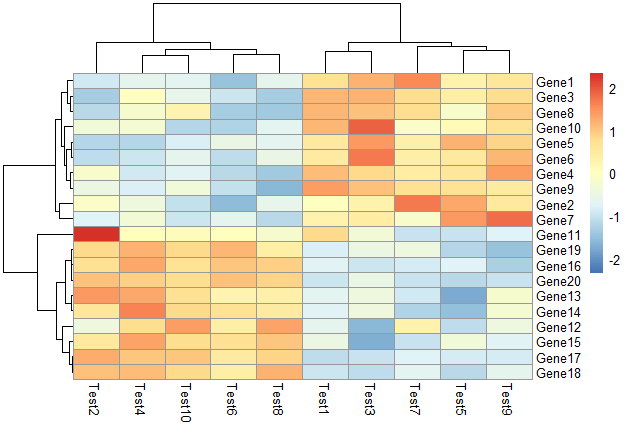
根据行进行scale,对行根据相关性进行聚类

1
pheatmap(test, scale = "row", clustering_distance_rows = "correlation")

图标

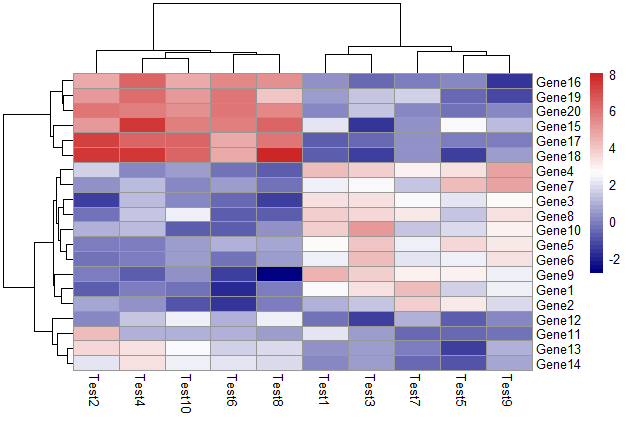
修改颜色

1
pheatmap(test, color = colorRampPalette(c("navy", "white", "firebrick3"))(50))

图标

不对行进行聚类

1
pheatmap(test, cluster_row = FALSE)

图标

不显示图例标签

1
pheatmap(test, legend = FALSE)

图标

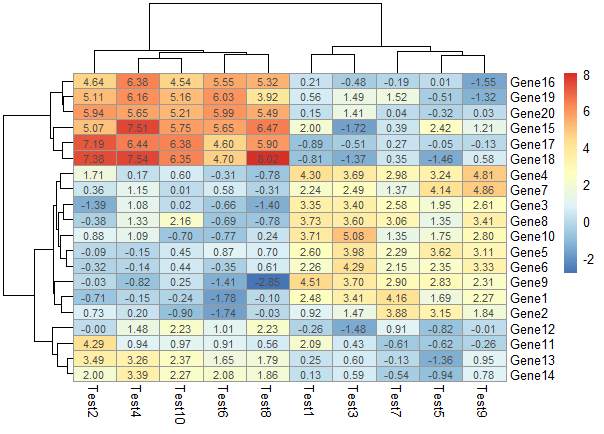
显示相关性数字

1
pheatmap(test, display_numbers = TRUE)

图标

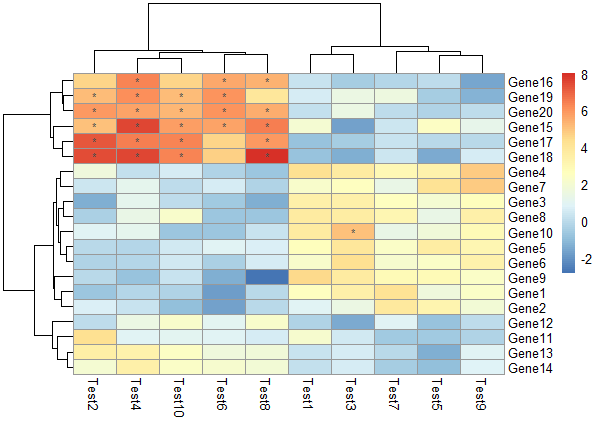
不显示数字,对符合要求的格子用符号表示

1
2
pheatmap(test, display_numbers = matrix(ifelse(test > 5, "*", ""), 
nrow(test)))

图标

修改图例

1
2
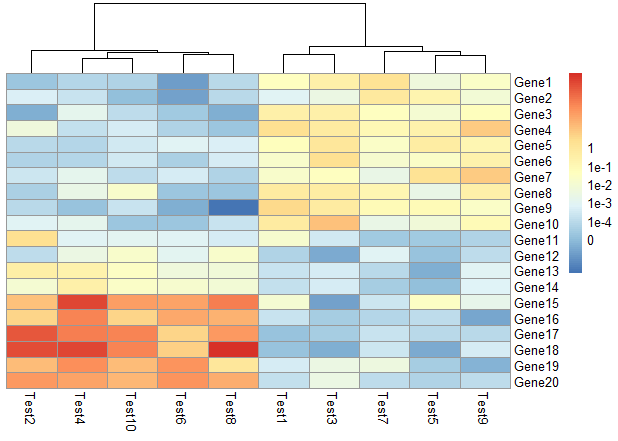
pheatmap(test, cluster_row = FALSE, legend_breaks = -1:4, 
legend_labels = c("0","1e-4", "1e-3", "1e-2", "1e-1", "1"))

图标

main设置标题、cellheight、cellwidth设置格子宽度和高度

1
2
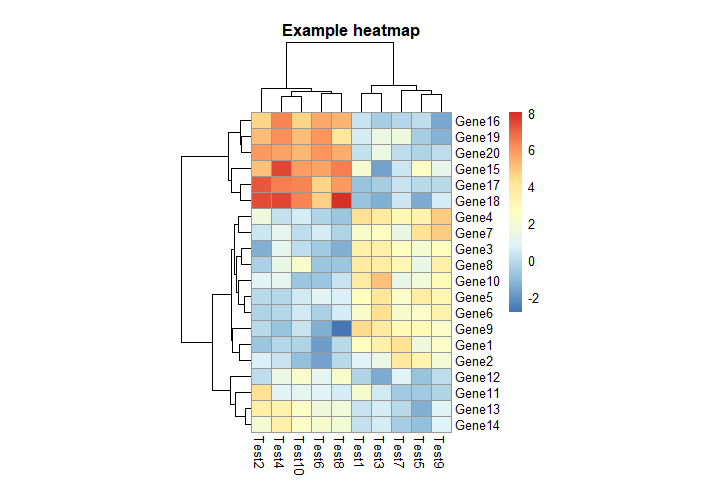
pheatmap(test, cellwidth = 15, cellheight = 12, 
main = "Example heatmap")

图标

3. 对行和列进行分类注释

首先构建行和列分类的dataframe。

1
2
3
4
5
6
7
8
9
10
11
12
13
14
15
16
17
18
19
20
21
22
23
24
25
26
27
# Generate annotations for rows and columns
annotation_col = data.frame(
CellType = factor(rep(c("CT1", "CT2"), 5)),
Time = 1:5
)
rownames(annotation_col) = paste("Test", 1:10, sep = "")

annotation_row = data.frame(
GeneClass = factor(rep(c("Path1", "Path2", "Path3"), c(10, 4, 6)))
)
rownames(annotation_row) = paste("Gene", 1:20, sep = "")
head(annotation_row)
GeneClass
Gene1 Path1
Gene2 Path1
Gene3 Path1
Gene4 Path1
Gene5 Path1
Gene6 Path1
head(annotation_col)
CellType Time
Test1 CT1 1
Test2 CT2 2
Test3 CT1 3
Test4 CT2 4
Test5 CT1 5
Test6 CT2 1

修改行分类标签

1
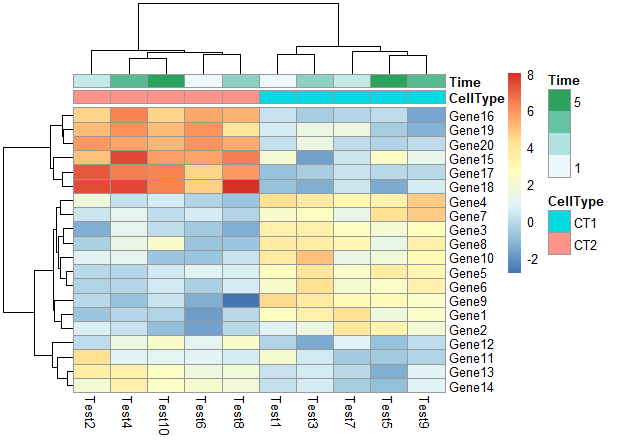
pheatmap(test, annotation_col = annotation_col)

图标

不显示行分类标签的注释的legend

1
pheatmap(test, annotation_col = annotation_col, annotation_legend = FALSE)

图标

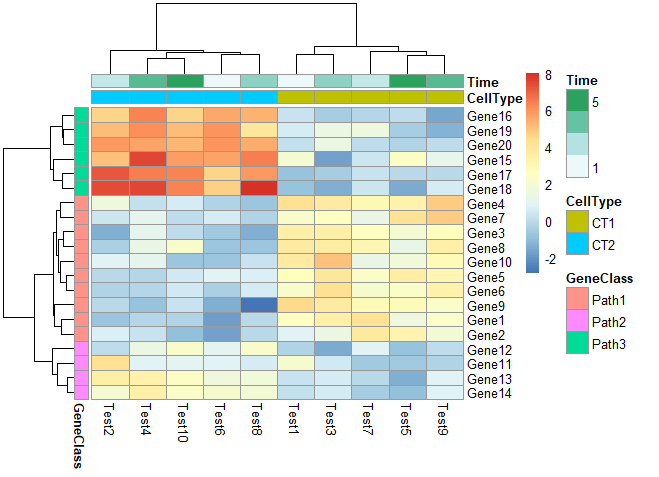
修改行分类标签和列分类标签

1
pheatmap(test, annotation_col = annotation_col, annotation_row = annotation_row)

图标

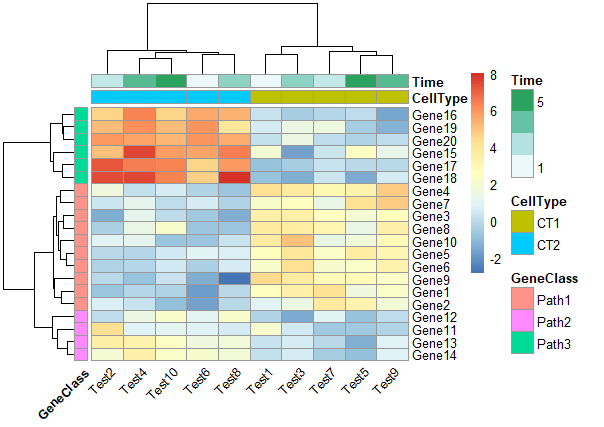
修改列名角度

1
pheatmap(test, annotation_col = annotation_col, annotation_row = annotation_row,angle_col = "45")

图标

4. 修改行和列的分类颜色

1
2
3
4
5
6
7
8
9
10
11
12
13
14
15
16
ann_colors = list(
Time = c("white", "firebrick"),
CellType = c(CT1 = "#1B9E77", CT2 = "#D95F02"),
GeneClass = c(Path1 = "#7570B3", Path2 = "#E7298A", Path3 = "#66A61E")
)
ann_colors
$Time
[1] "white" "firebrick"

$CellType
CT1 CT2
"#1B9E77" "#D95F02"

$GeneClass
Path1 Path2 Path3
"#7570B3" "#E7298A" "#66A61E"

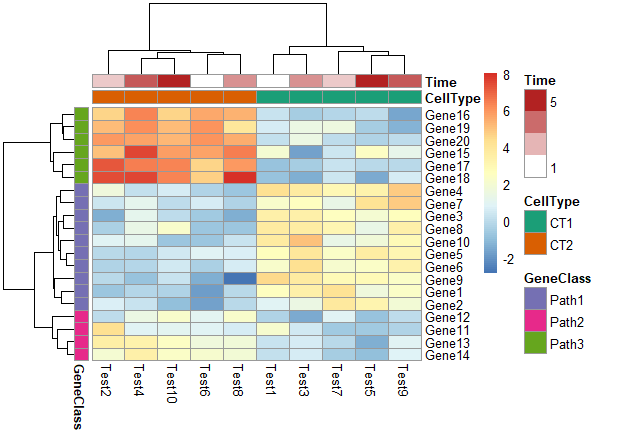
颜色与ann_colors一一对应

1
2
3
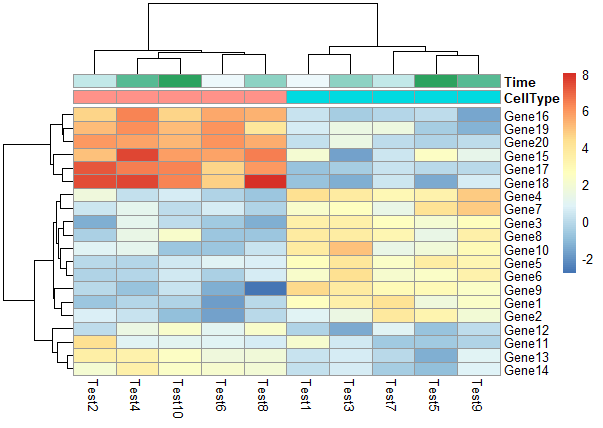
pheatmap(test, annotation_col = annotation_col, 
annotation_row = annotation_row,
annotation_colors = ann_colors)

图标

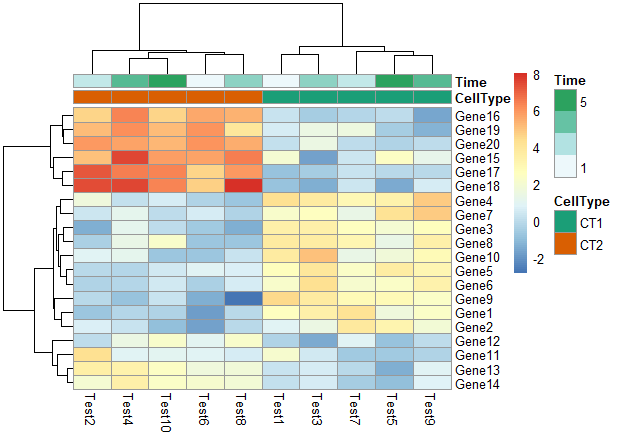
颜色为ann_color[2]

1
2
pheatmap(test, annotation_col = annotation_col, 
annotation_colors = ann_colors[2])

图标

5. 修改行名、列名

1
2
3
4
labels_row = c("", "", "", "", "", "", "", "", "", "", "", "", "", "", "", 
"", "", "Il10", "Il15", "Il1b")

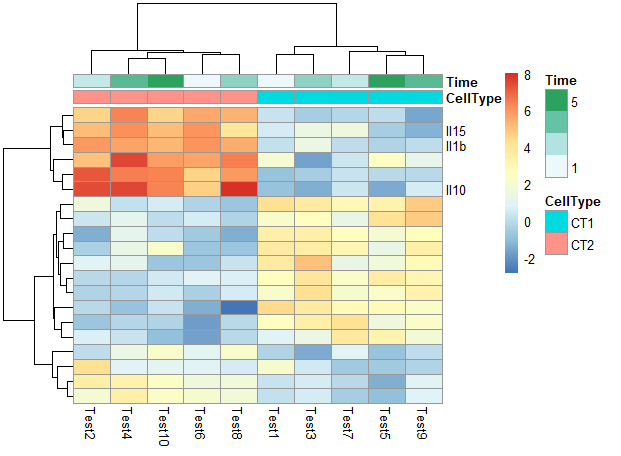
pheatmap(test, annotation_col = annotation_col, labels_row = labels_row)

图标

6. 其他

在热图中根据聚类添加gap

1
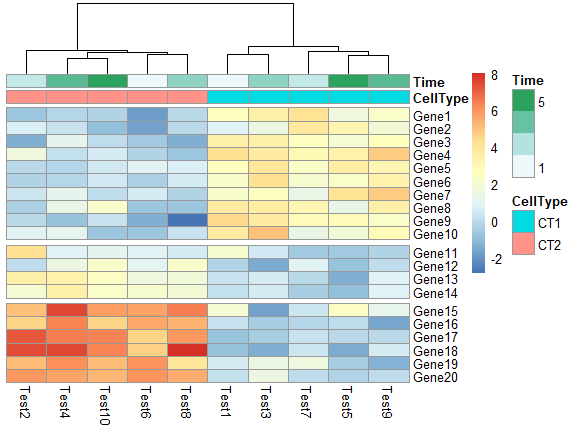
pheatmap(test, annotation_col = annotation_col, cluster_rows = FALSE, gaps_row = c(10, 14))

图标

1
2
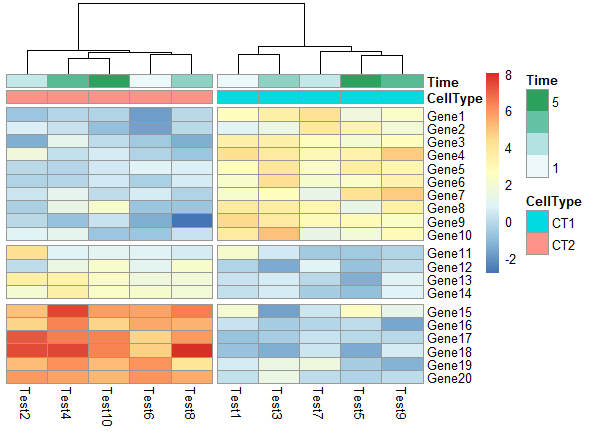
pheatmap(test, annotation_col = annotation_col, cluster_rows = FALSE, gaps_row = c(10, 14), 
cutree_col = 2)

图标

1
2
3
4
5
6
7
8
9
10
11
12
13
# Specifying clustering from distance matrix
drows = dist(test, method = "minkowski")
dcols = dist(t(test), method = "minkowski")
pheatmap(test, clustering_distance_rows = drows, clustering_distance_cols = dcols)

# Modify ordering of the clusters using clustering callback option
callback = function(hc, mat){
sv = svd(t(mat))$v[,1]
dend = reorder(as.dendrogram(hc), wts = sv)
as.hclust(dend)
}

pheatmap(test, clustering_callback = callback)